
Purpose
This SOP describes how to add chart and text widgets to an Asana project dashboard to visualize task data and add custom content.
Scope
This procedure is intended for Asana project members with access to the Dashboard tab. Use this SOP when you need to add visual charts or text content to your project dashboard.
Prerequisites
Logged in to Asana with your account
Access to a project with Dashboard functionality enabled
Procedure
- Step 1 of 6
Navigate to app.asana.com
Open your Asana project dashboard
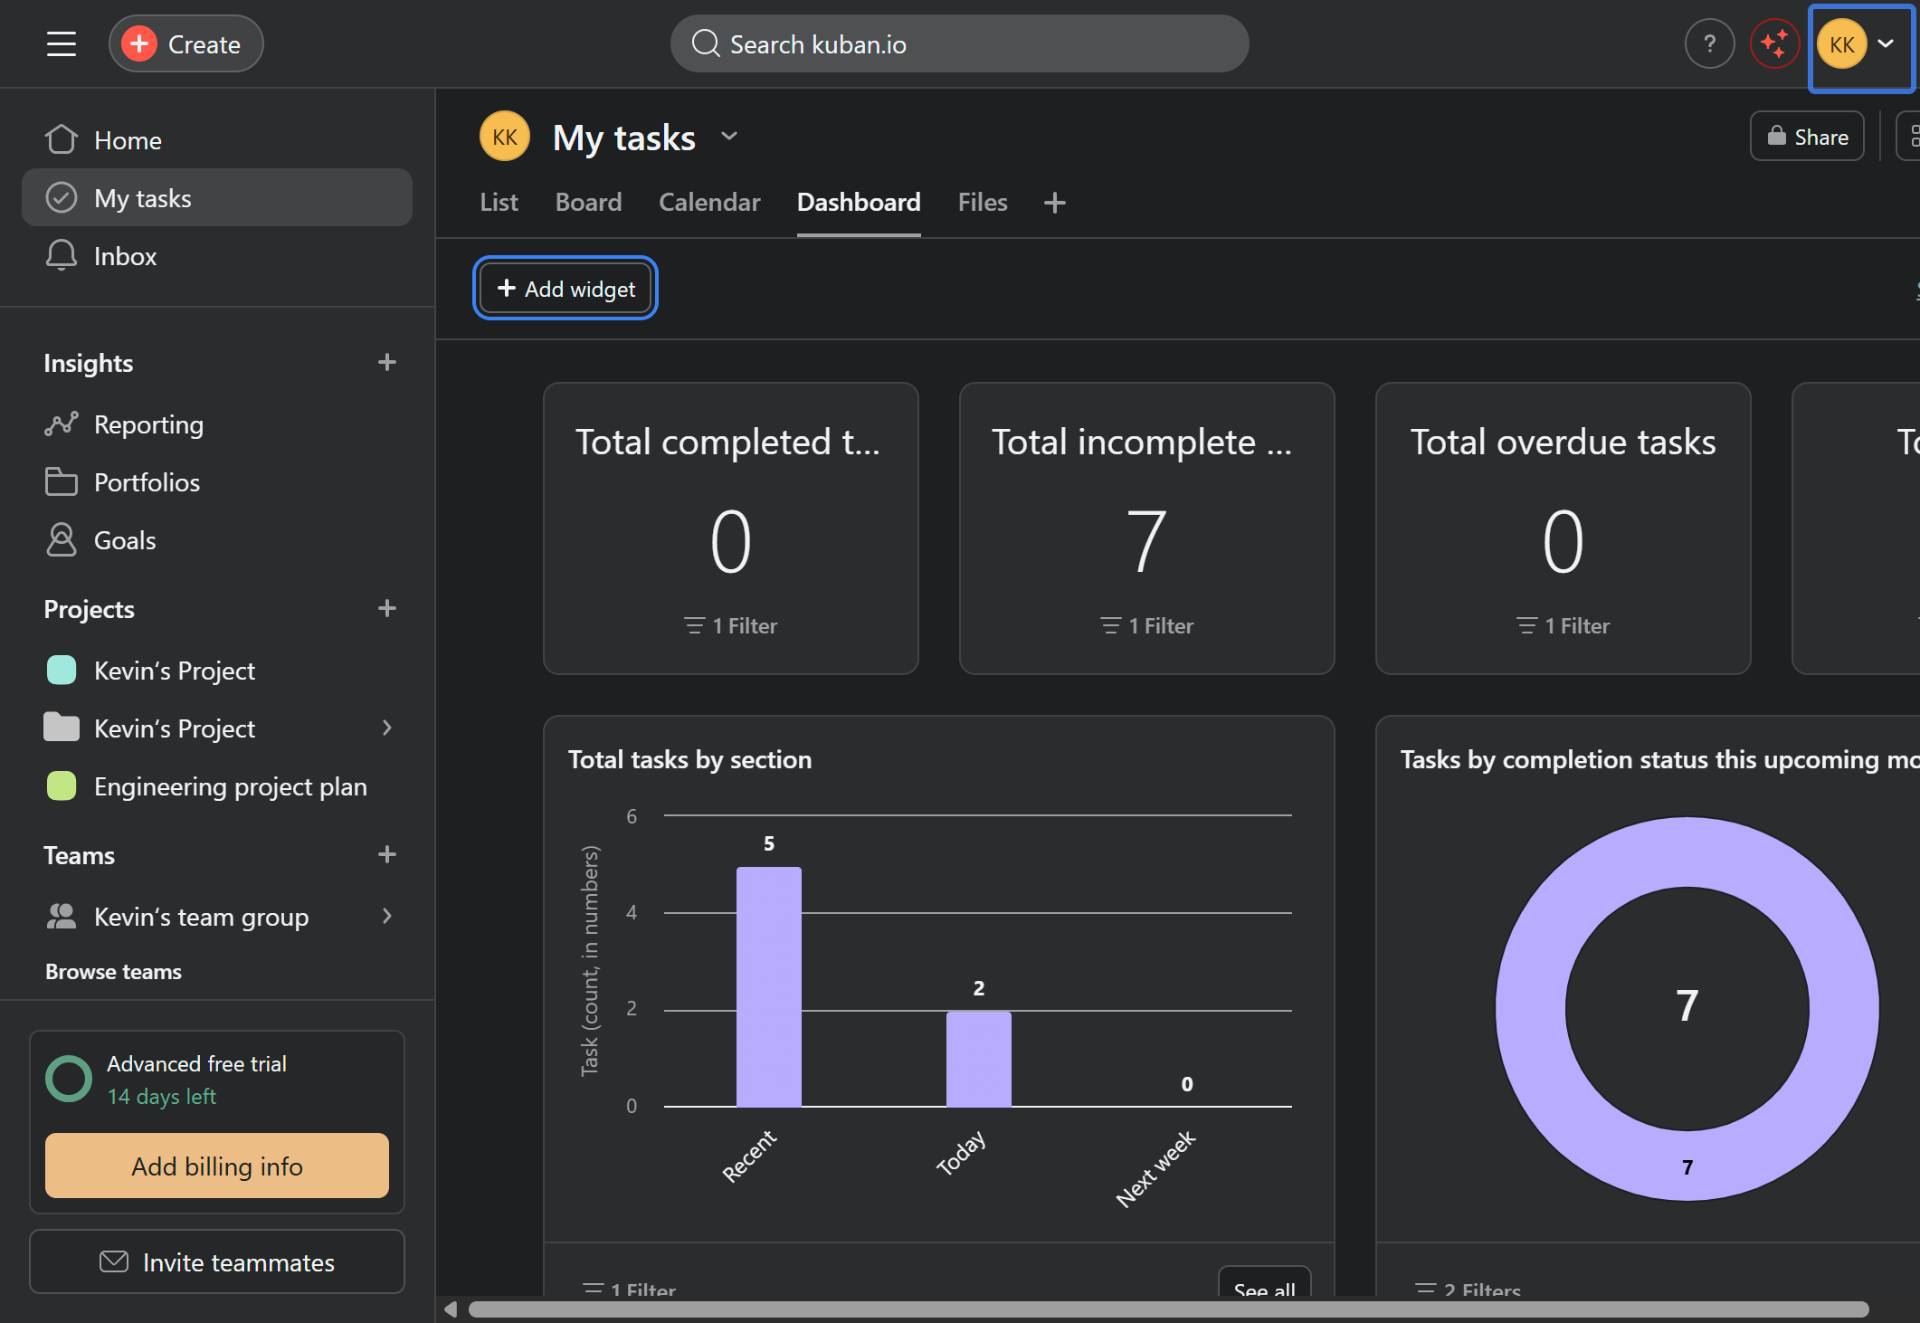
Navigate to app.asana.com and open the project where you want to add widgets. Click the Dashboard tab to access the project dashboard.

- Step 2 of 6
Click Add widget
Click the Add widget button
Click the Add widget button located at the top of the dashboard to open the widget type menu.
- Step 3 of 6
Select widget type
Choose Chart or Text widget
Select the type of widget you want to add:

- Step 4 of 6
Configure chart settings
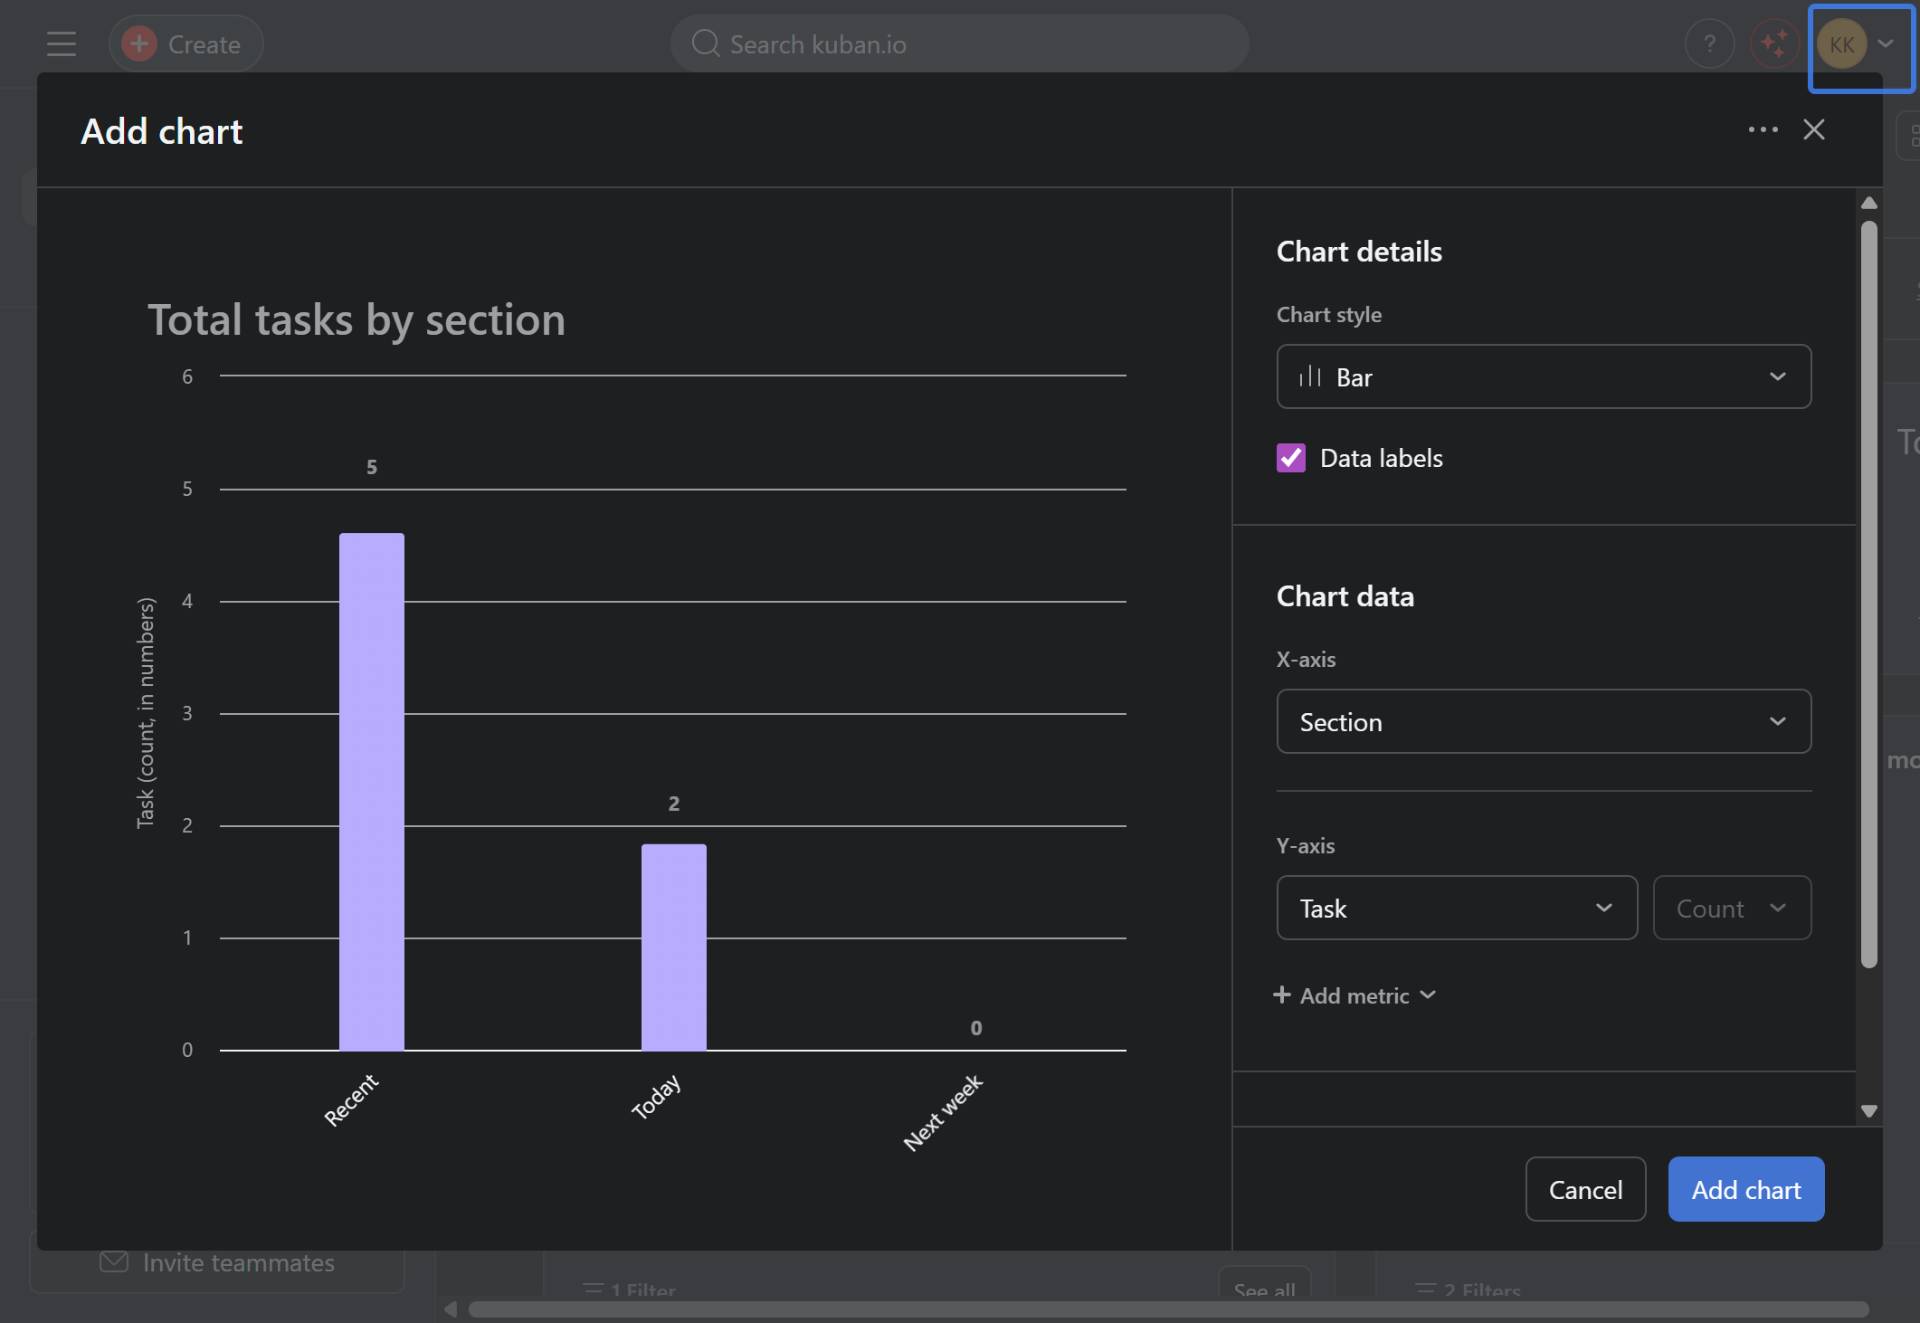
Customize the chart configuration
The Add chart dialog opens with a preview on the left and configuration options on the right. Configure the following settings:
- Step 5 of 6
Add the chart
Click the Add chart button
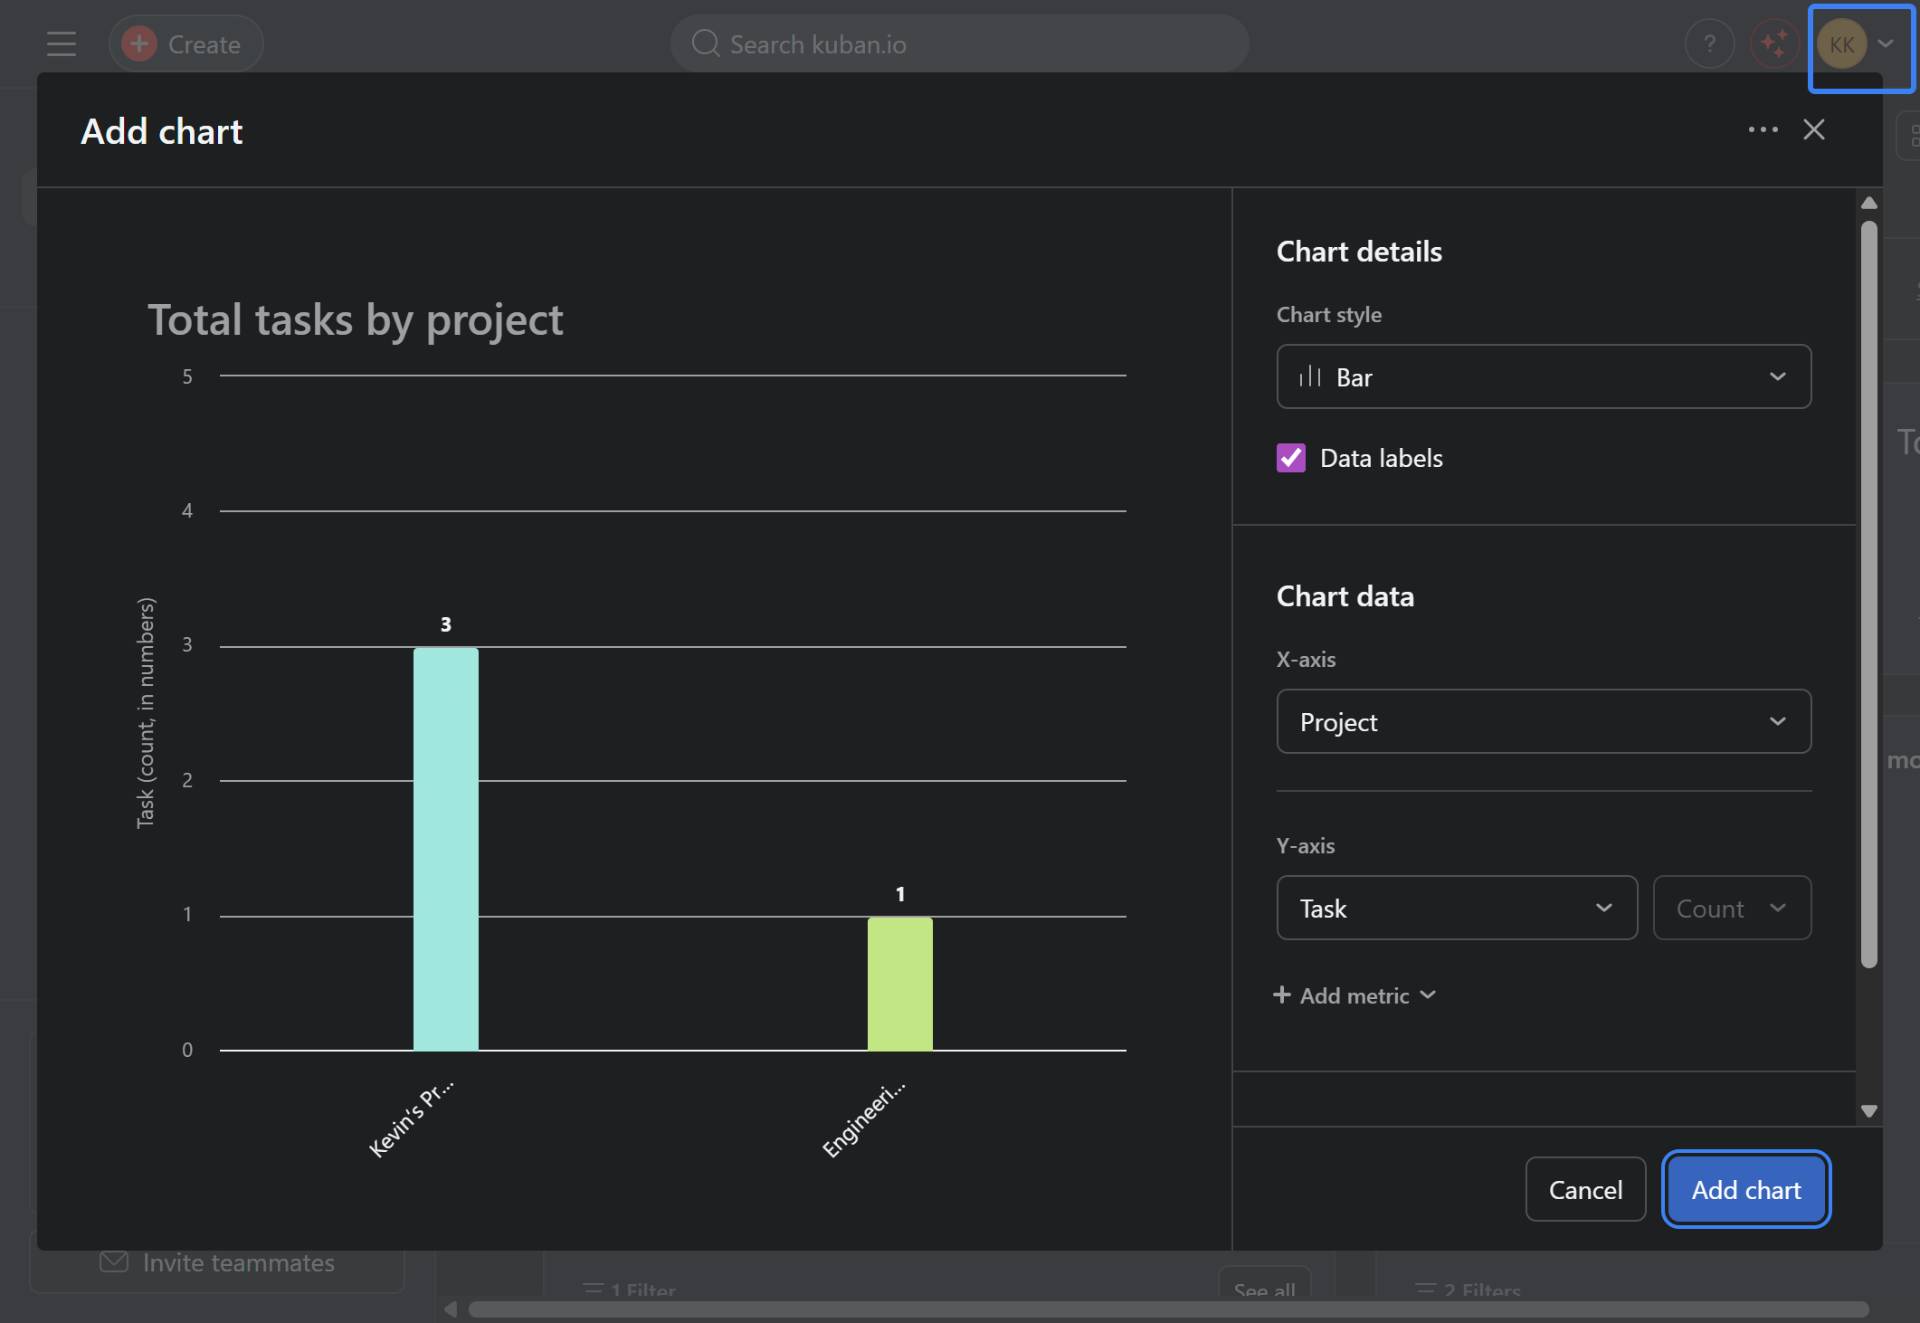
Review the chart preview on the left side of the dialog to ensure it displays the data correctly. Once satisfied with the configuration, click the Add chart button to add the widget to your dashboard.
- Step 6 of 6
Verify widget placement
Confirm the chart appears on the dashboard
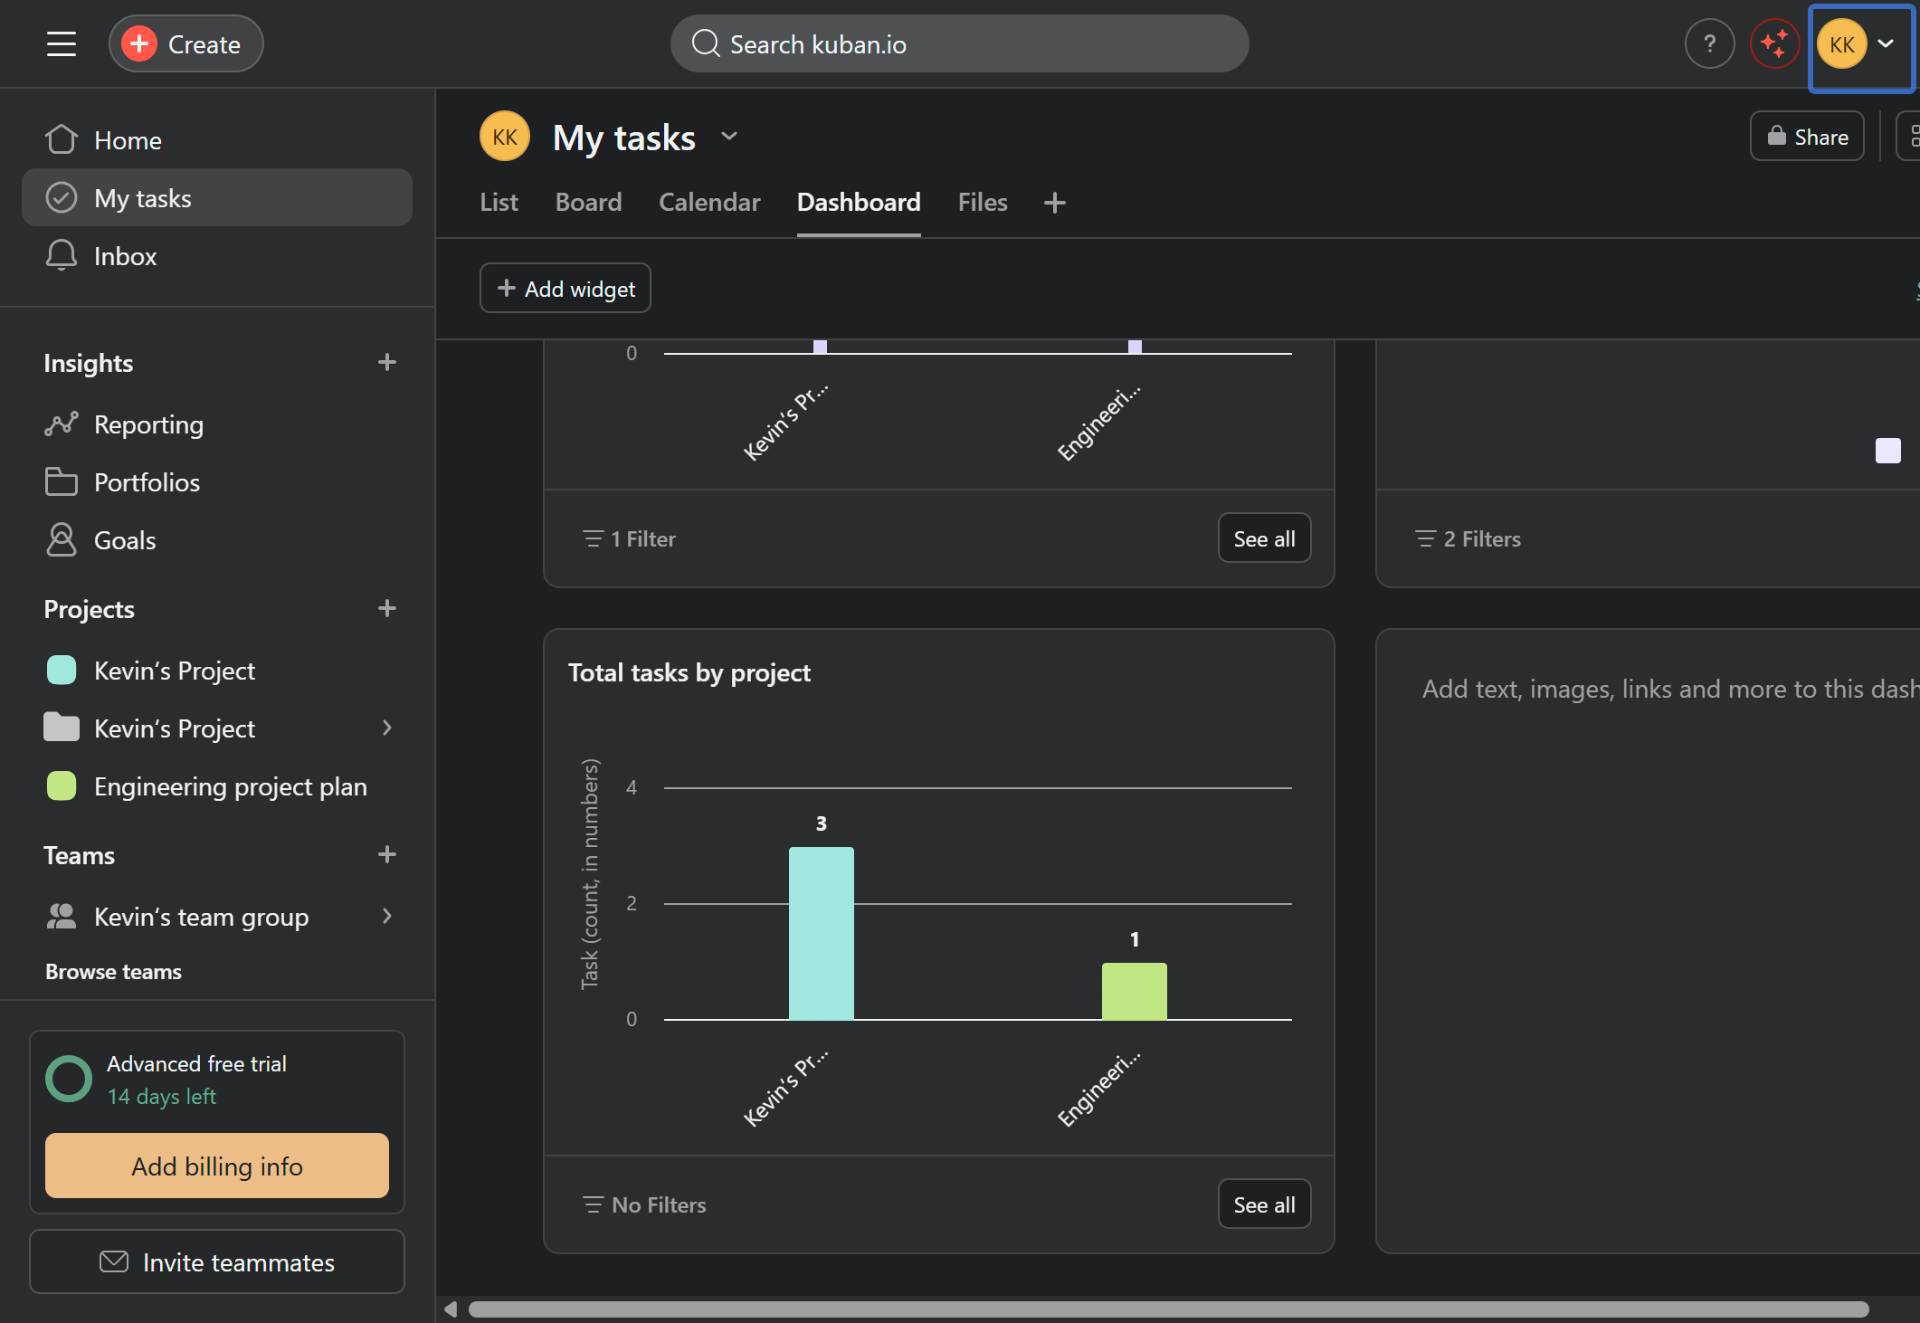
The new chart widget will appear on your dashboard displaying the configured data. You can resize, move, or edit the widget by hovering over it and using the available controls.
Verification
Confirm the widget was added successfully:
The new widget appears on the dashboard with the correct title and data visualization.
The chart displays data according to your selected X-axis grouping (Assignee, Project, Section, etc.).
For chart widgets: The visualization matches the selected chart style (Bar, Donut, etc.).
Conclusion
You have successfully added a chart widget to your Asana project dashboard. The widget will automatically update as task data changes in your project.